Back to UtilityDirect Main Menu
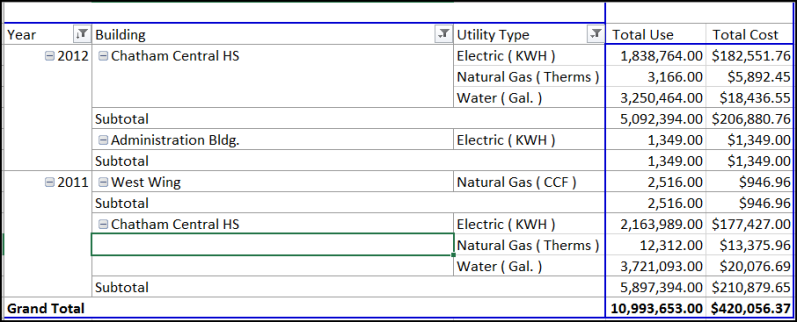
The Global Building Use/Cost by Utility Report shows the Total Use and Total Cost for each Building by single or multiple utility types and years as a Pivot Table in Excel. From the Pivot Table you can apply multiple filters to further refine the data.
How to Run the Global Building Use/Cost by Utility Report
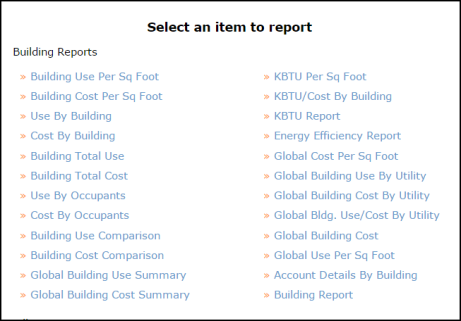
- Click on Report in the Actions menu, and then click on Global Bldg. Use/Cost By Utility.
- Use Steps 3 through 8 to narrow down the report by Building Type, Utility Type, Months, Years, Report Criteria, etc. *Note: If you need to highlight more than one item in a selection box, click on your first item, then hold down your Ctrl key when selecting the others.
- Select Excel as the Report Format in Step 9.
- Click Print at the bottom of the page to open the Excel report.
- If you would like to save this report as a Saved Action, you can enter a Saved Report Title and click Print & Save to make it available on the Saved Action screen.